Polarization Color Chart
You can see colors when you put a double reflex substance between crossed polarizers. This color is called polarization color. This color sometimes called interference color, probably because of the color order is similar between two. But this color does not come from the interference of light. Two light waves having the same wavelength and polarization can interfere each other. And interference color happens without polarizers. In the double reflex substance between crossed polarizers, polarized incident light propagate the substance as the two intrinsic rays. The polarization planes of intrinsic rays crossed at a right angle. Such rays cannot interfere each other. A phase difference between rays happens after passing through the substance. Ray becomes elliptically polarized light and the projection to the second polarizer pass through it.
In polarization color, an important variable is a retardation, which is defined as the product of the thickness and birefringence of the sample. The polarization color starts from black when the retardation is zero. As the retardation increases, color changes from gray, yellow, red-purple, blue, cyan, yellow, and finally becomes gray. Polarization color tells us information about the retardation. Therefore, a color chart showing polarization color of each retardation is a useful tool for estimate the retardation of the sample.
A polarization color chart is a two-dimensional color chart. The vertical axis of the chart is birefringence. The horizontal axis is the thickness of a sample. Several oblique lines are drawn in the chart. They show the relationship between the retardation and thickness. Figure 1 shows a typical polarization color chart. The maximum value of the retardation is usually taken around 1500nm. Polarization color becomes dull beyond this value and estimation of retardation from the color becomes difficult.
Such charts were made by hand painting in the old days. Now the polarization color chart can be easily made using a computer. Most of polarization color charts have been made assuming the birefringence is independent of the wavelength of light. In other words, the dispersion of the birefringence is ignored. We call such charts as standard polarization color charts.
Please note that the colors of the polarization color chart vary
depending on the type of illumination source. Below are the
polarization color charts using CIE-A, D50, and D65 light sources.
It is recommended to use the chart that matches the light source of
your system.
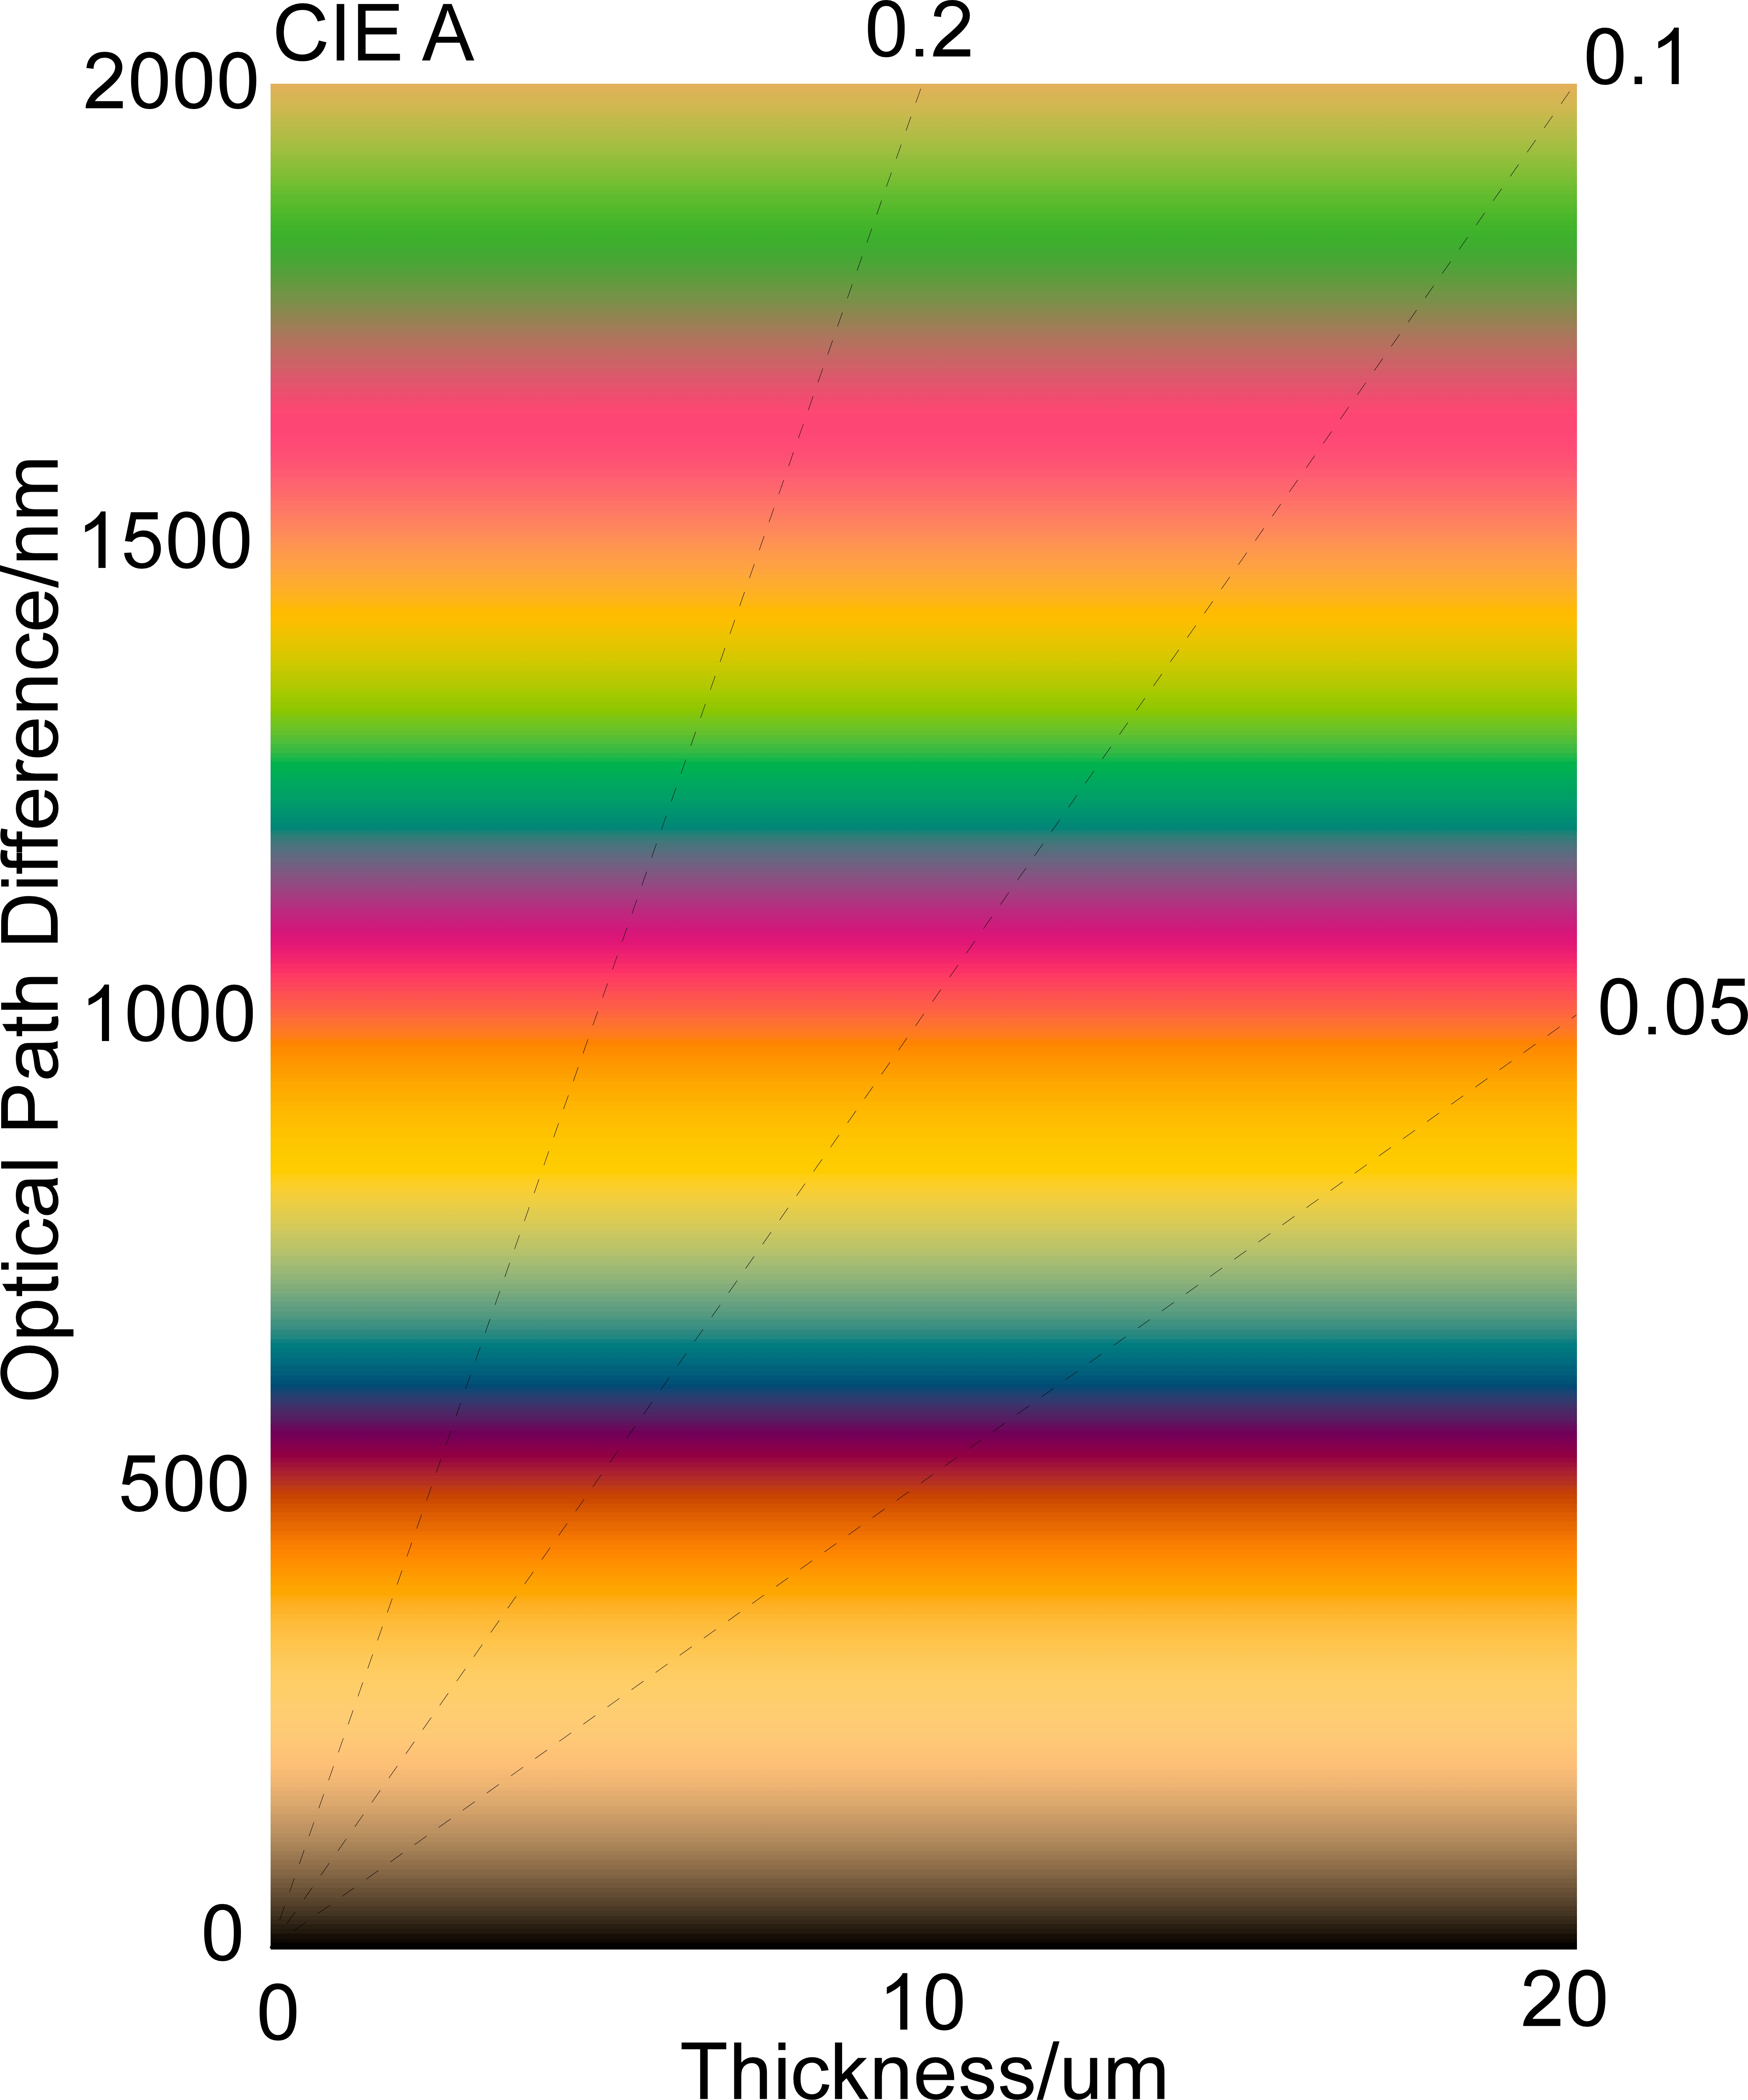
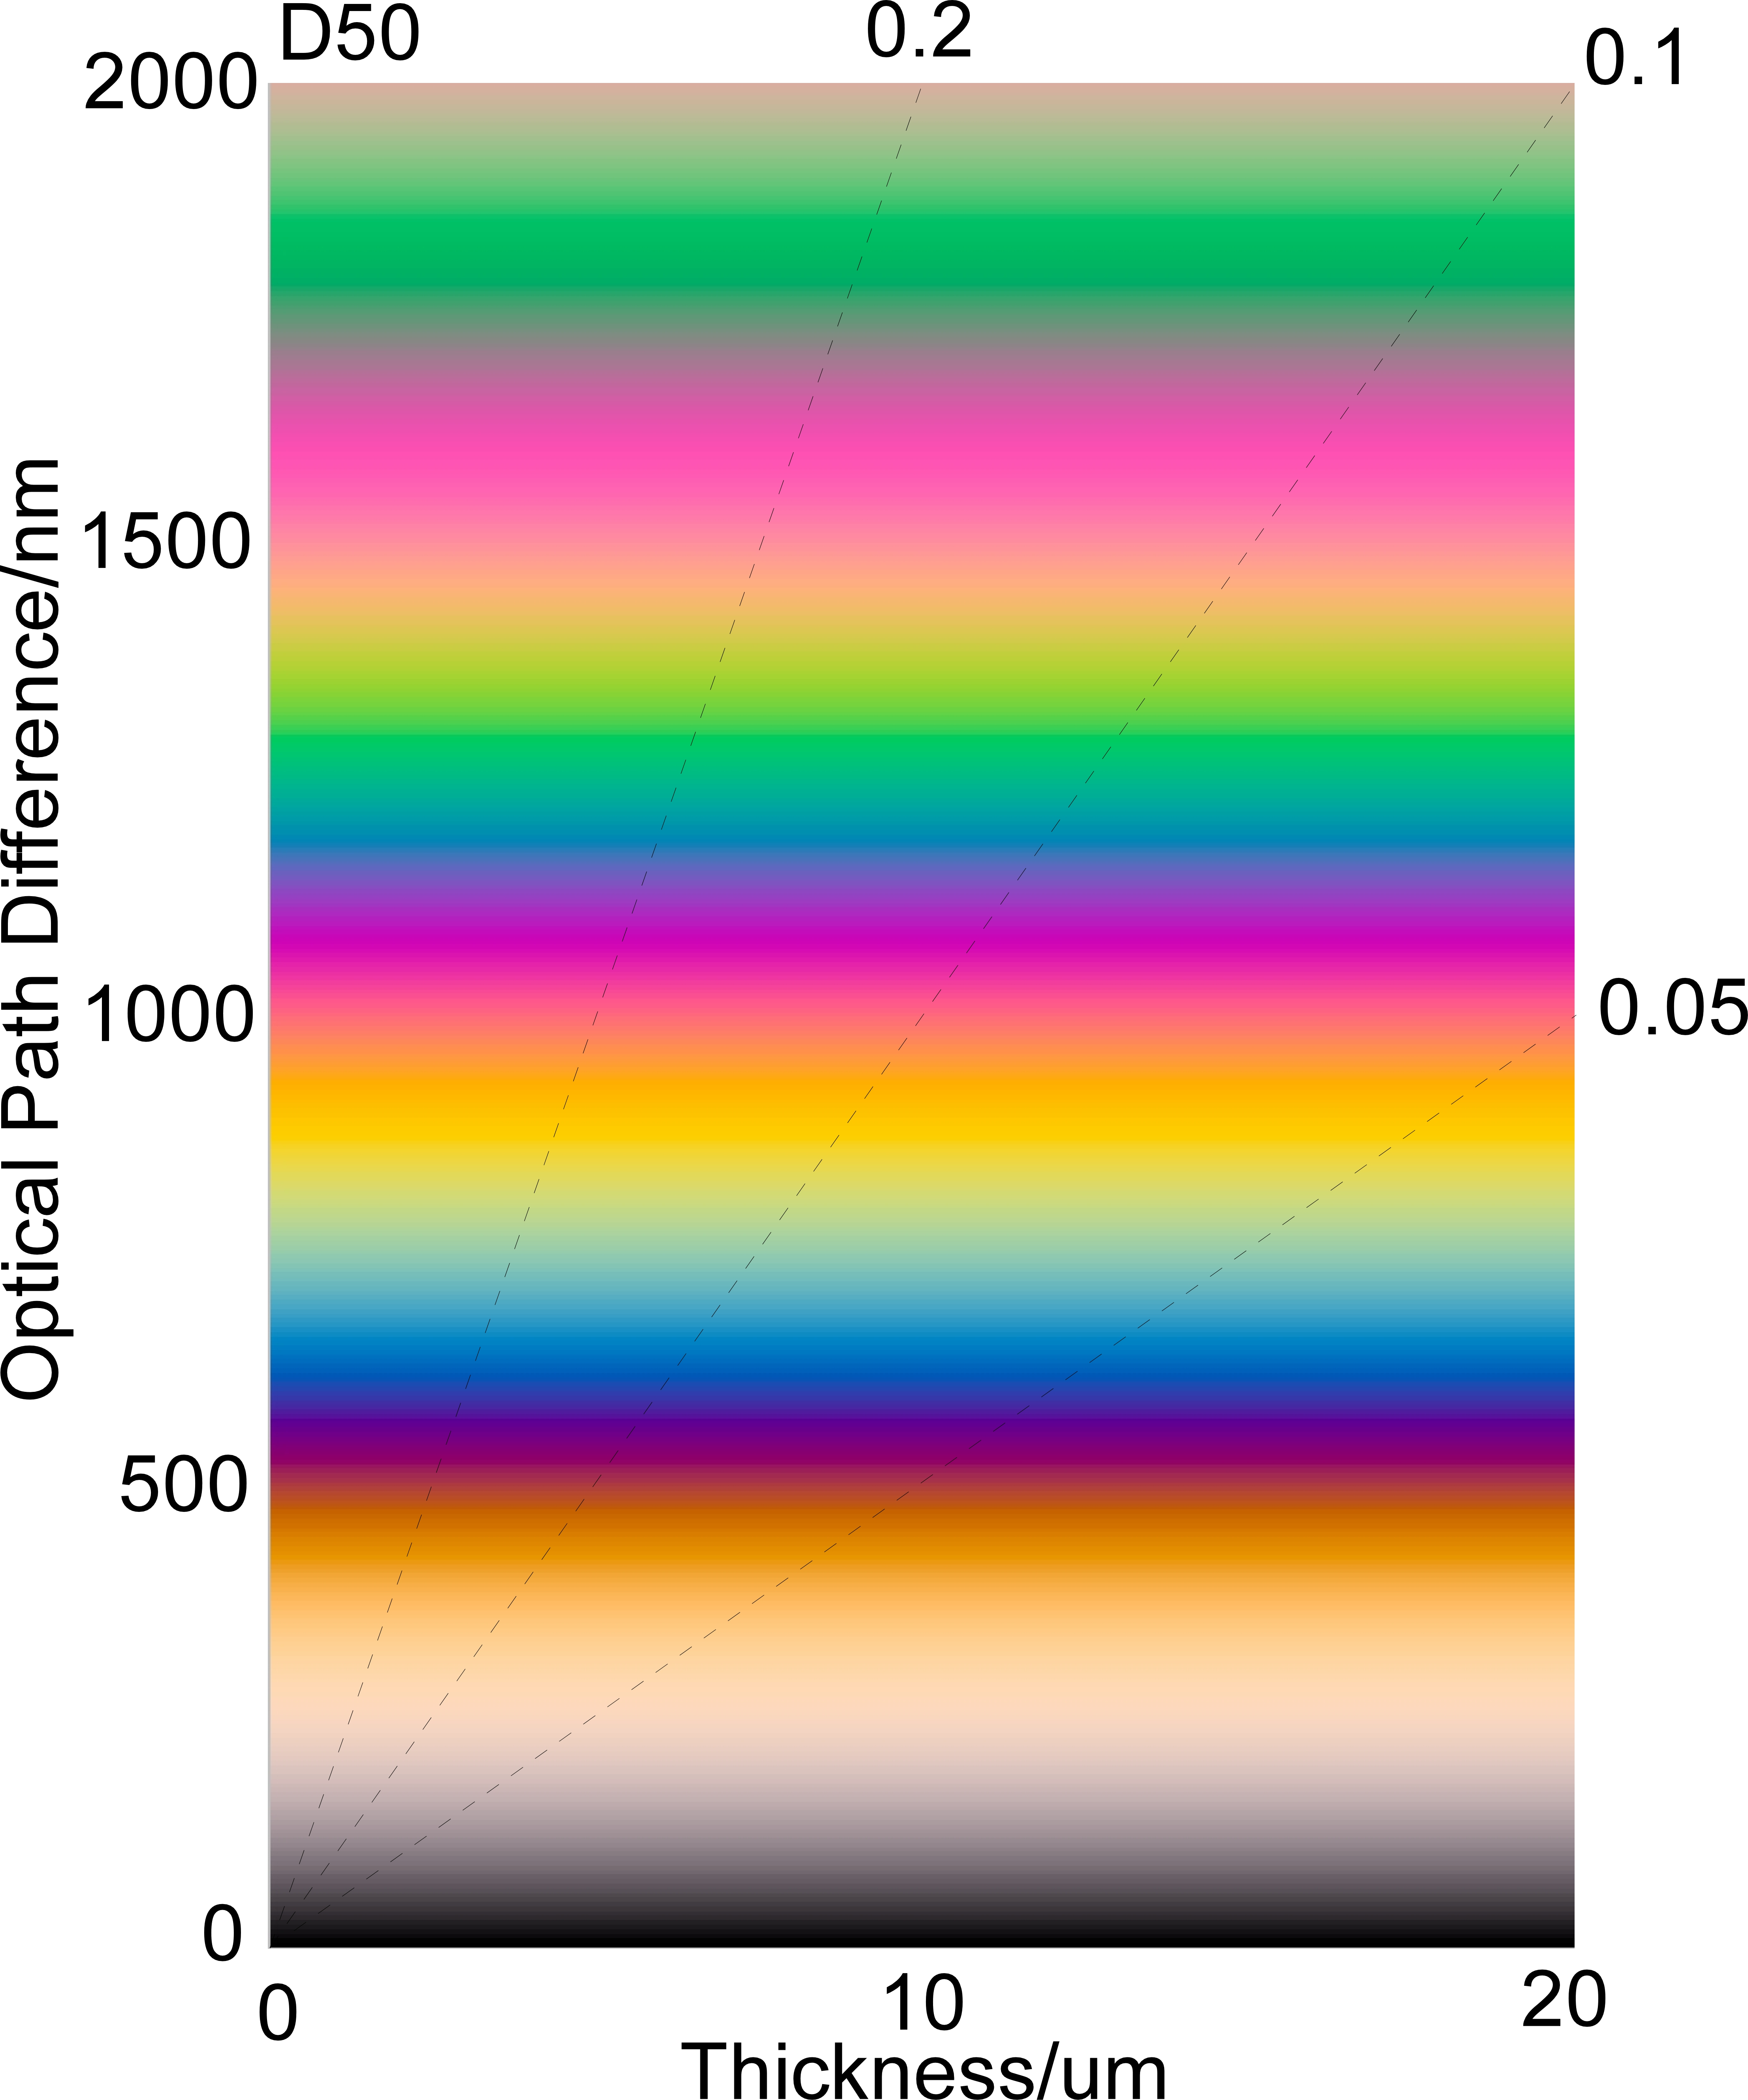
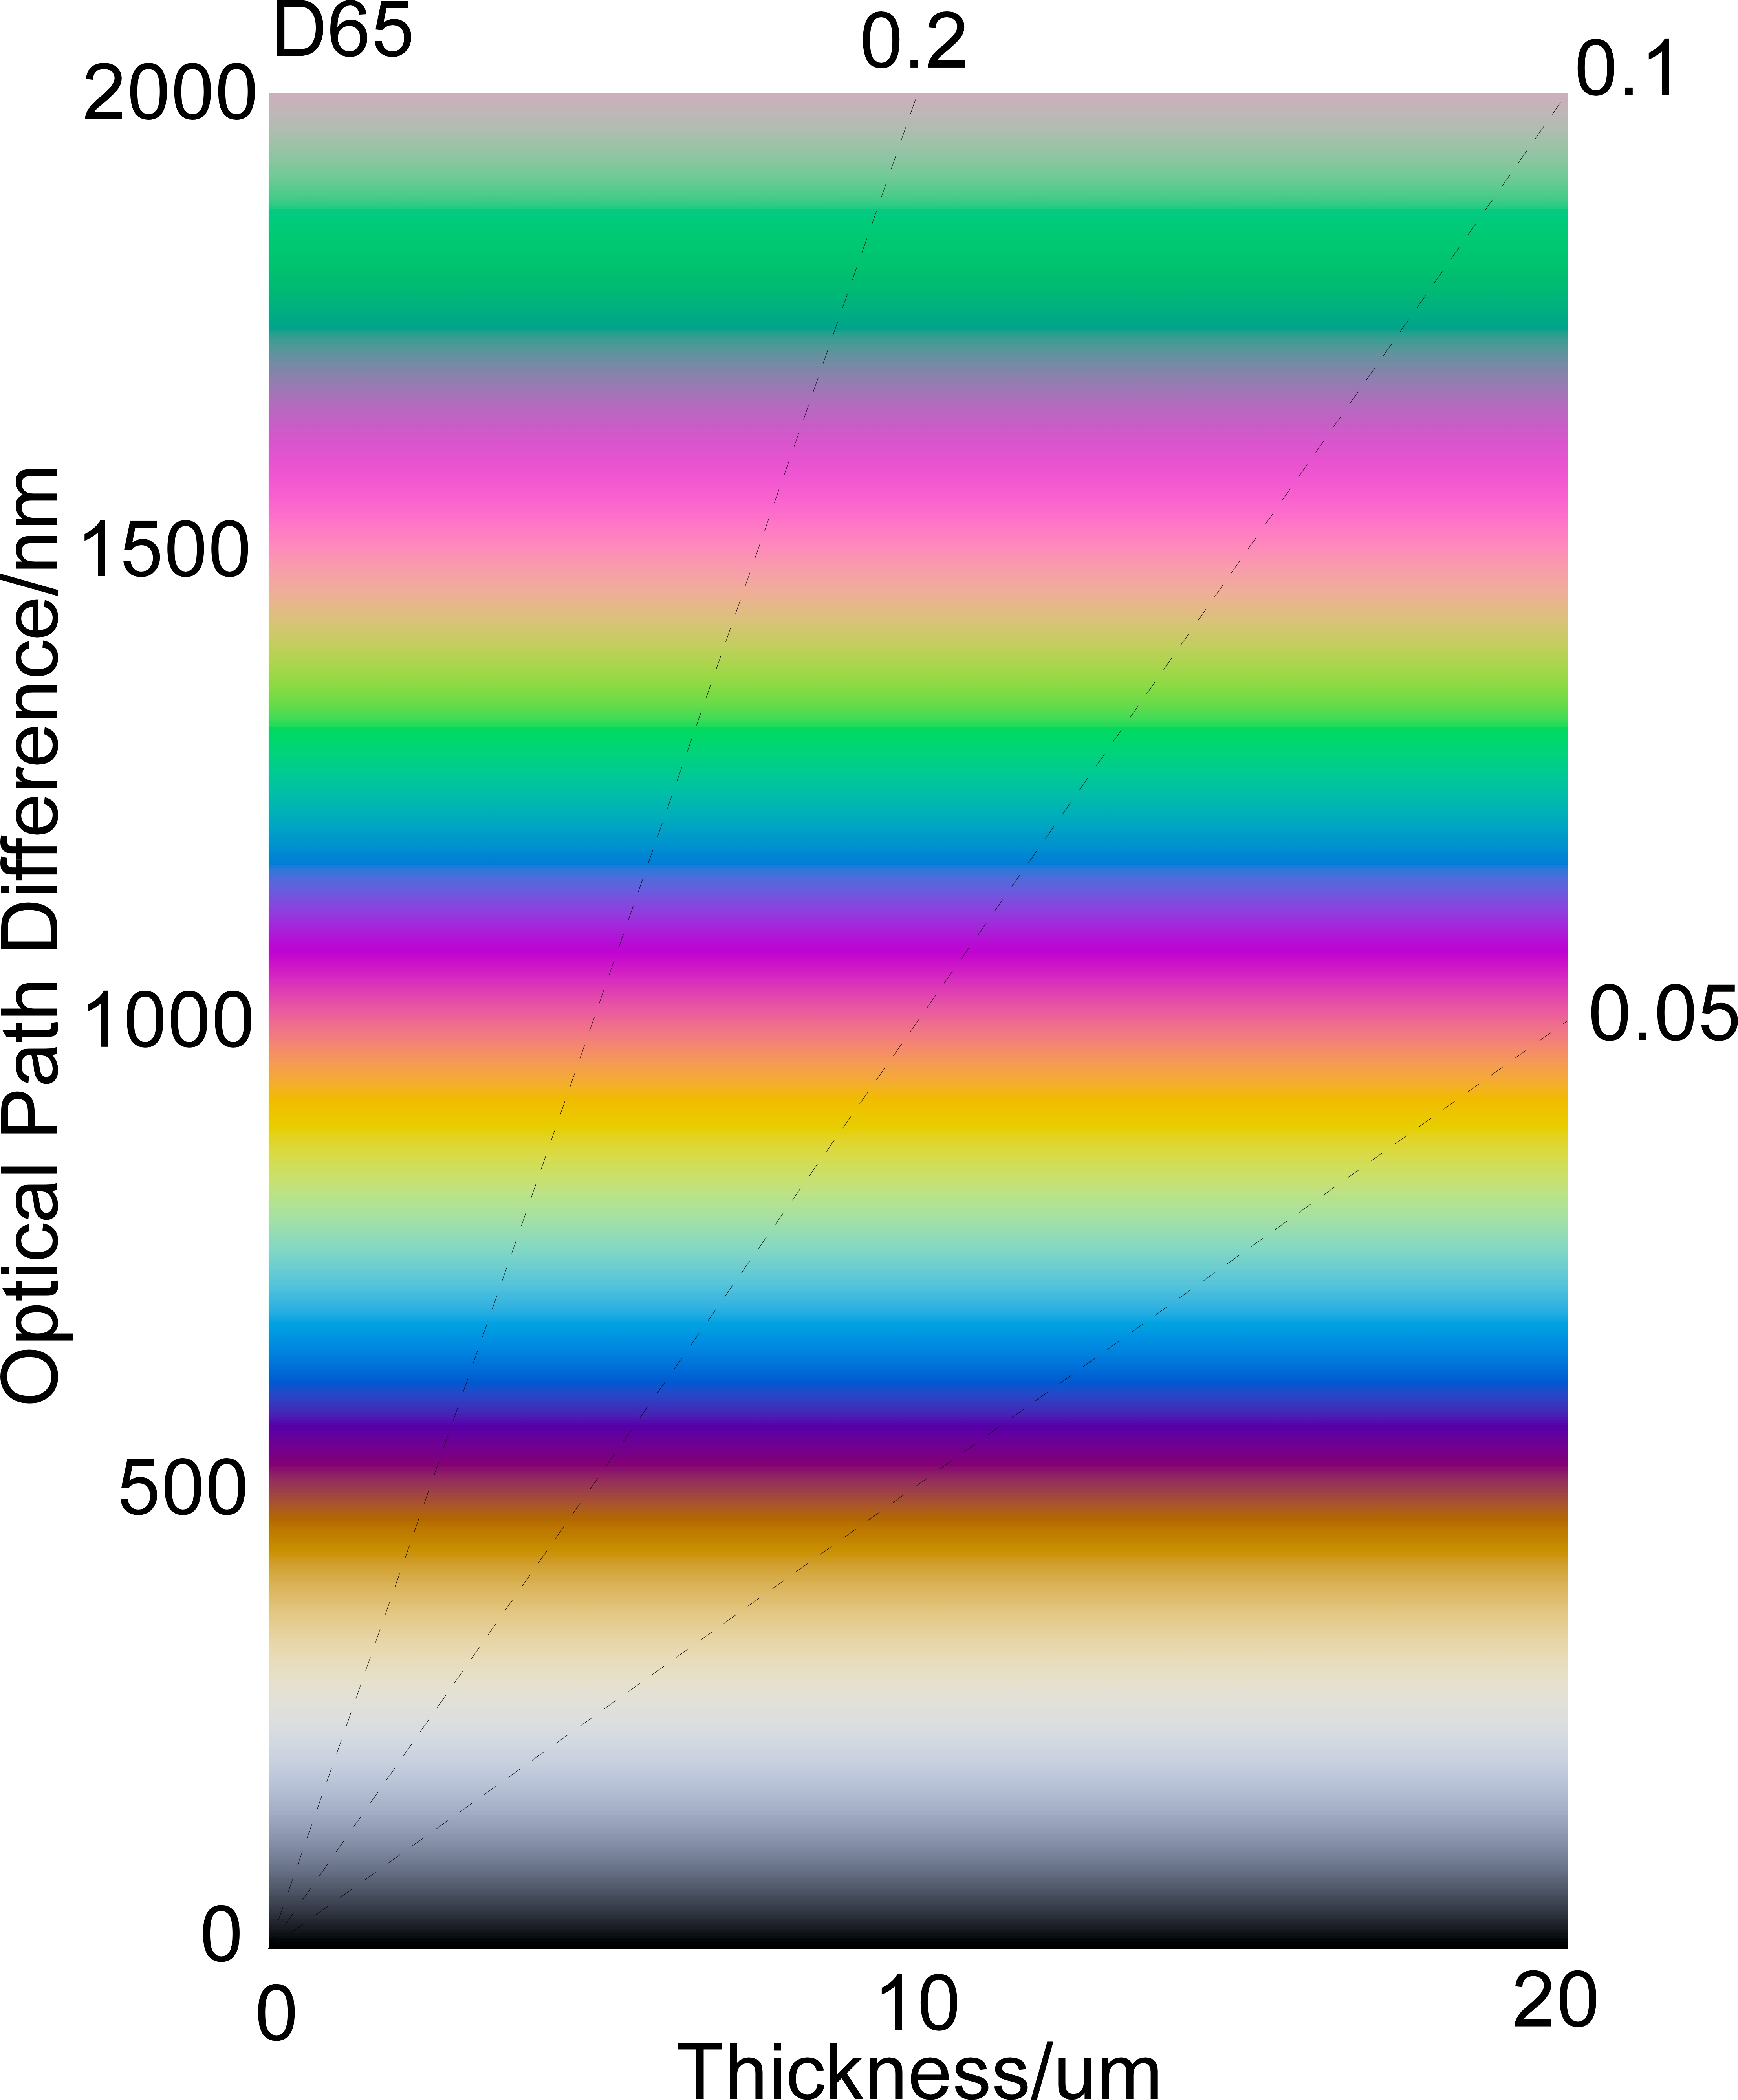
Fig. 1 Standard Polarization Color Chart of CIE-A,D50,D65
Polarimetric color charts used to be made by hand, but now they are
made by computer, so it is possible to make two dimensional charts
with sample thickness on the vertical axis and birefringence on the
horizontal axis
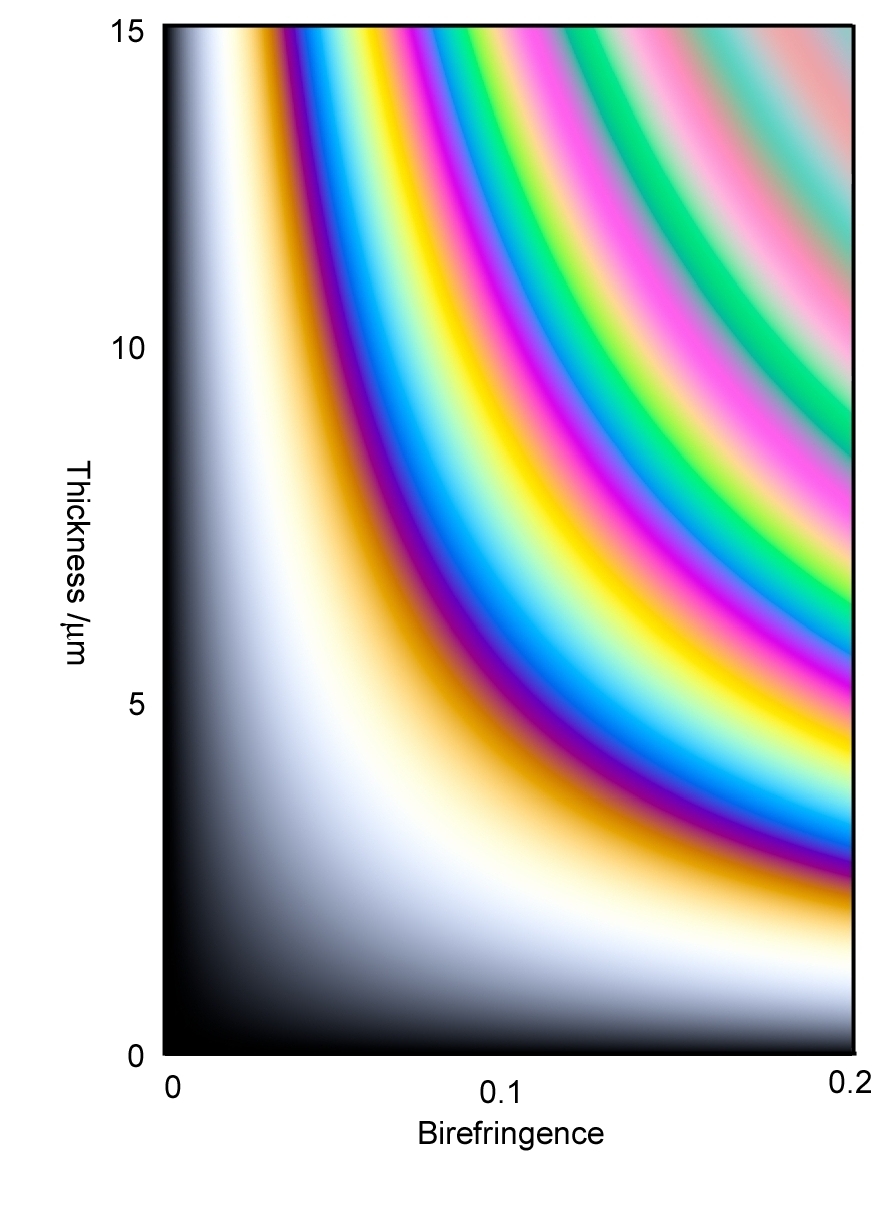
Fig. 2 2D Polarization Color Chart
.
Every substance has a dispersion of refractive index. The birefringence of double reflex substance also has dispersion. The dispersion makes a deviation in color from that of the standard chart. Tsuboi proposed an indication number of the birefringence dispersion defined by the following equation.
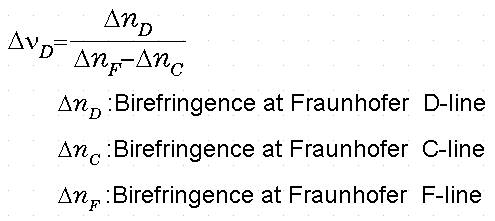
This number is small for large dispersion substances and big for small
dispersion substances. It diverges when the birefringence is independent
of the wavelength. According to Tsuboi, the deviation from the standard
color becomes serious when the number is smaller than 10. Calculated numbers
for 5CB and MBBA are 7.2 and 4.5 at 20 degrees C. Hence, the polarization
color charts of these materials should have a deviation from the standard
one. It was difficult to make charts for these strongly disperse materials.
Thanks to the development of personal computers and published dispersion
data of these materials, it becomes possible to make the charts of these
materials.
The vertical axis of the conventional polarization color chart is retardation.
This implementation is possible when the birefringence is independent of
wavelength. When the birefringence depends on the wavelength, we need to
set the standard wavelength to define the retardation of the sample. It
is one method to set the wavelength and take the retardation as the vertical
axis. Figure 2 is an example of such color chart. The vertical axis is
the birefringence at Fraunhofer D-line. The horizontal axis is the Tsuboi’s
indication number. Dispersion is calculated using the first and the second
terms of Cauchy’s approximation formula by setting B equals 0.
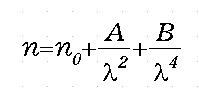
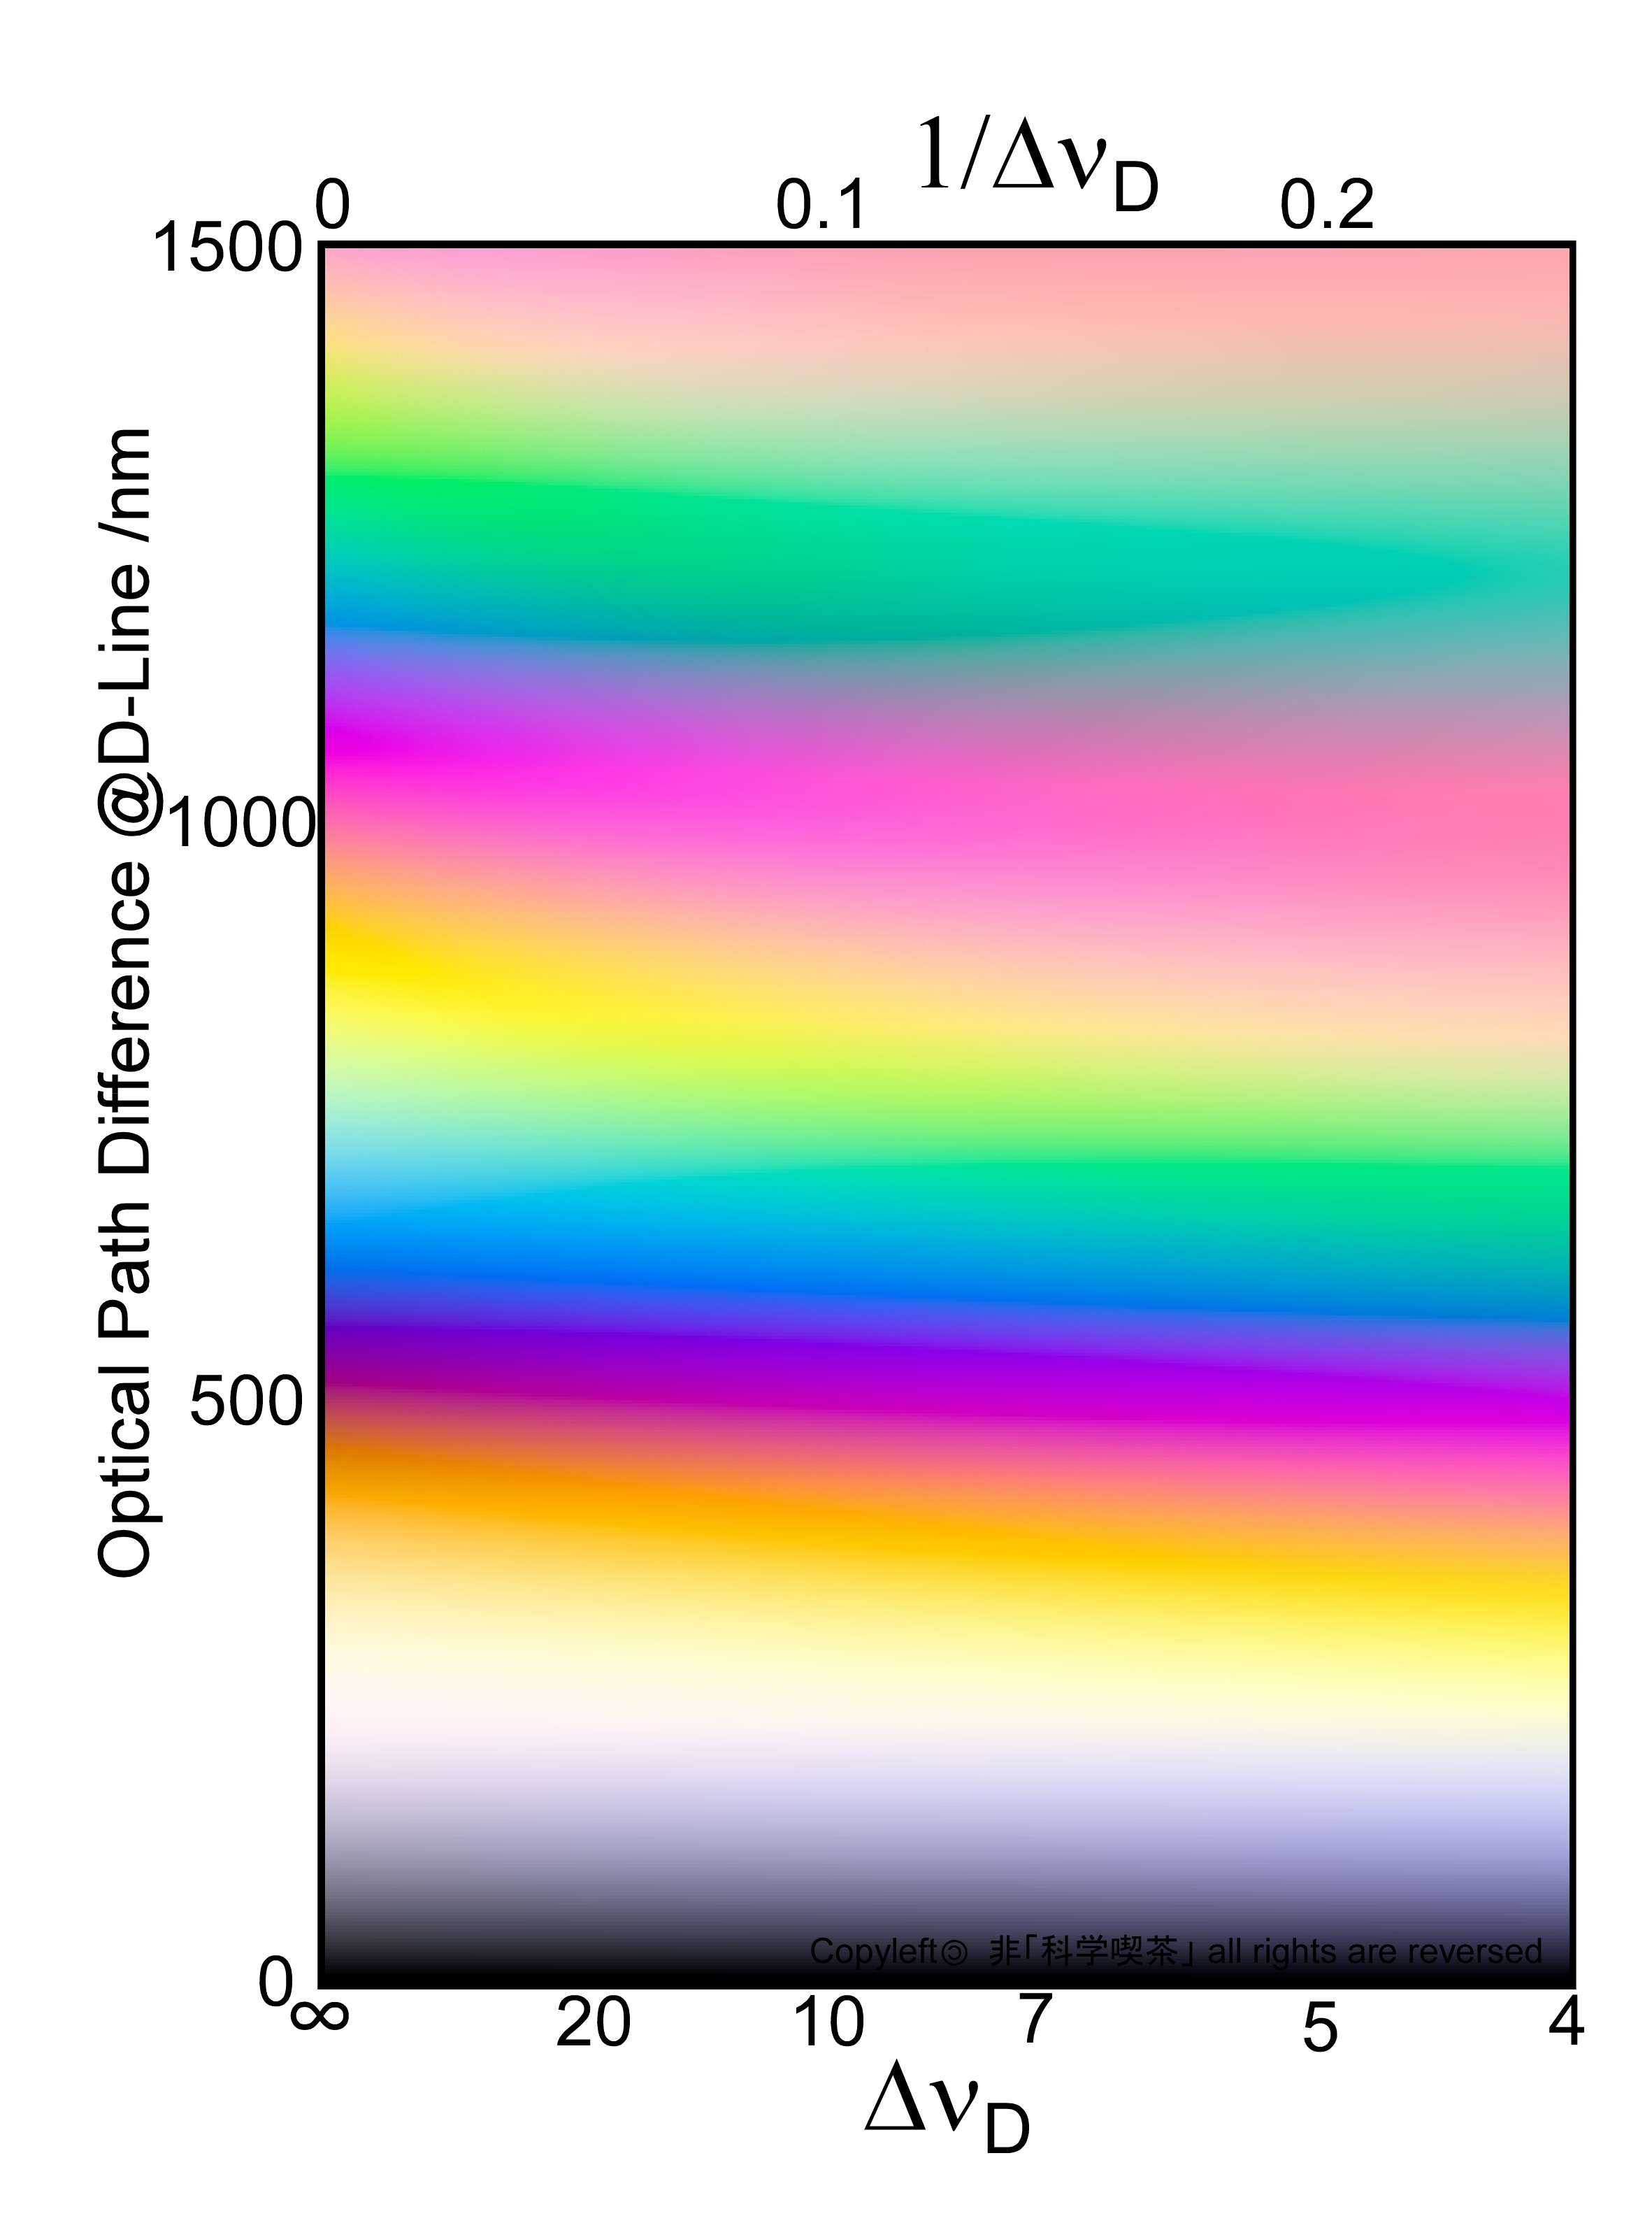
Fig. 3 Polarization Color Chart with consideration for dispersion
| Polarization Charts of 5CB and MBBA |
The measured B coefficients of 5CB and MBBA have finite values. Therefore,
color deviation of them can be different from those in Fig. 3 at each indication
value. Using reported Cauchy’s coefficients of 5CB and MBBA[1], it is possible
to calculate their the polarization colors. Polarization color of a particular
molecule like 5CB and MBBA directly relates to the cell thickness. It is
more convenient to take cell thickness as the vertical axis of the chart.
In that case, horizontal axis cannot be thickness.
We have space for setting other parameters on the horizontal axis. The
birefringence of the nematic phase has strong temperature dependence. It
is interesting to make a chart showing temperature-dependent polarization
color change. At this moment, this trial is hard to work out since Cauchy’s
coefficients of all nematic temperature range are not variable. Instead,
we show you polarization color charts of 5CB(Fig. 4) and MBBA(Fig. 5) showing
a color change in three temperatures using Cauchy’s coefficients.
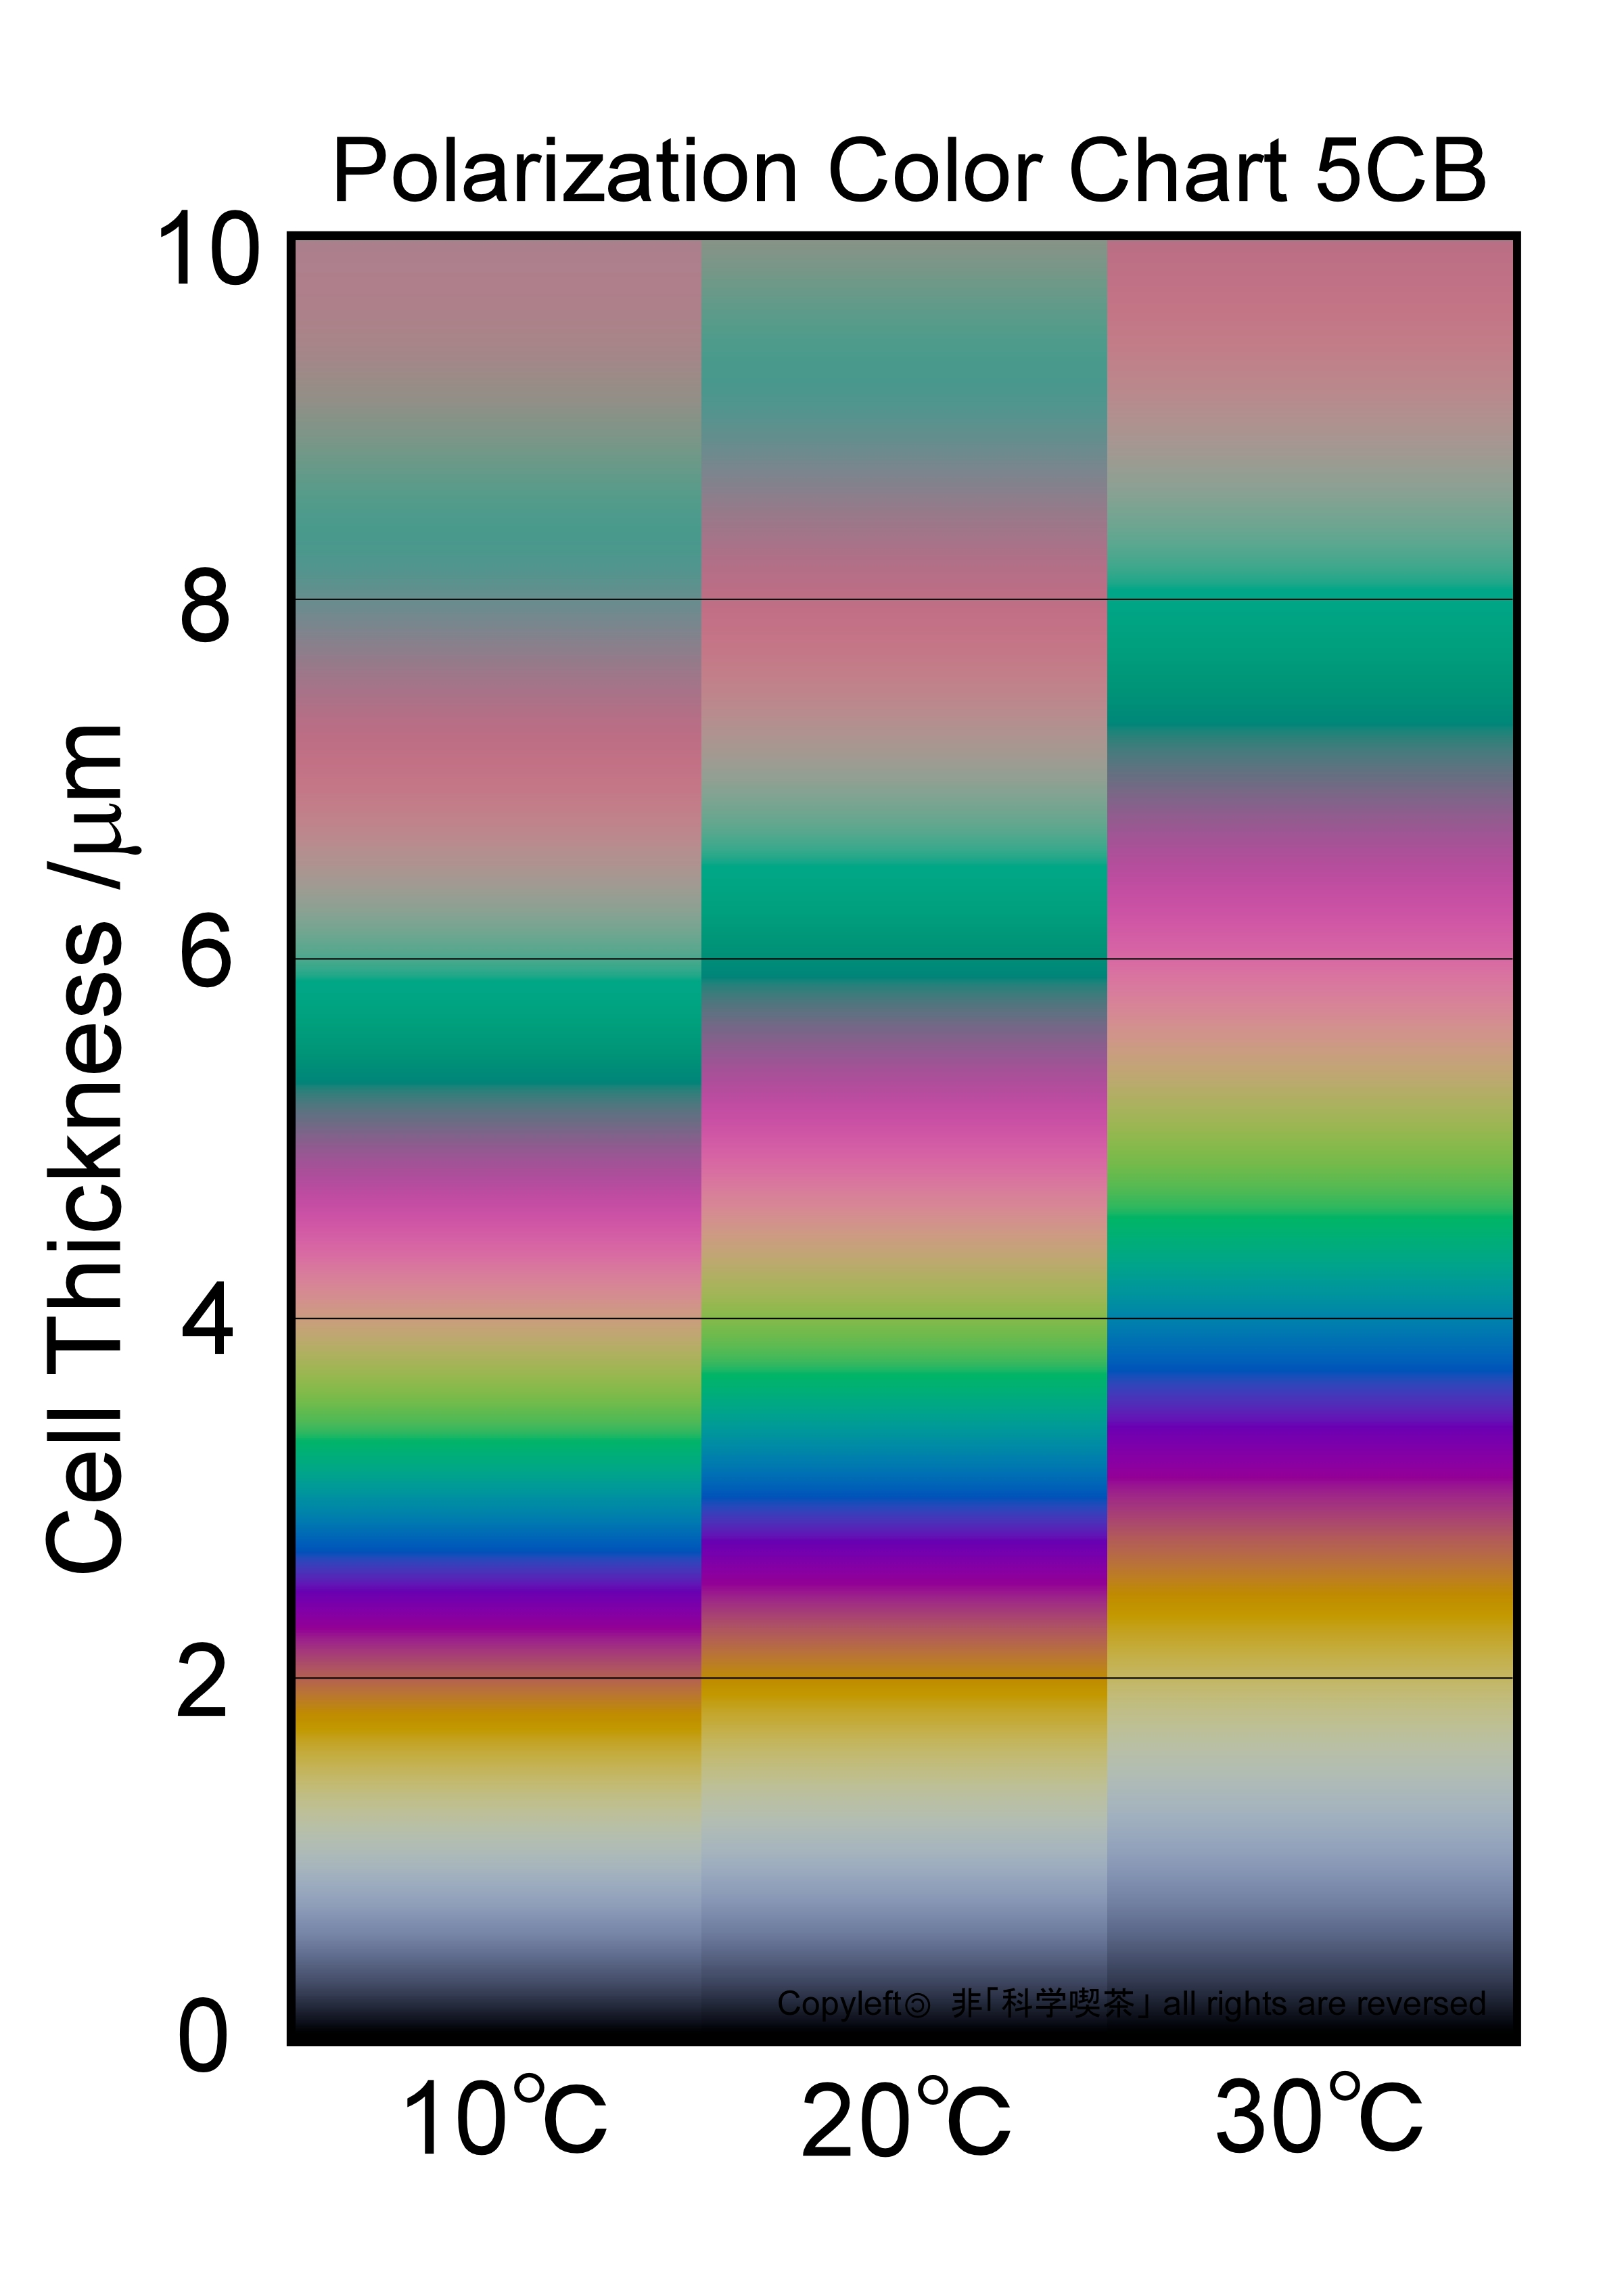
Fig.4 Polarization Color Chart created using Cauchy’s coefficients of 5CB
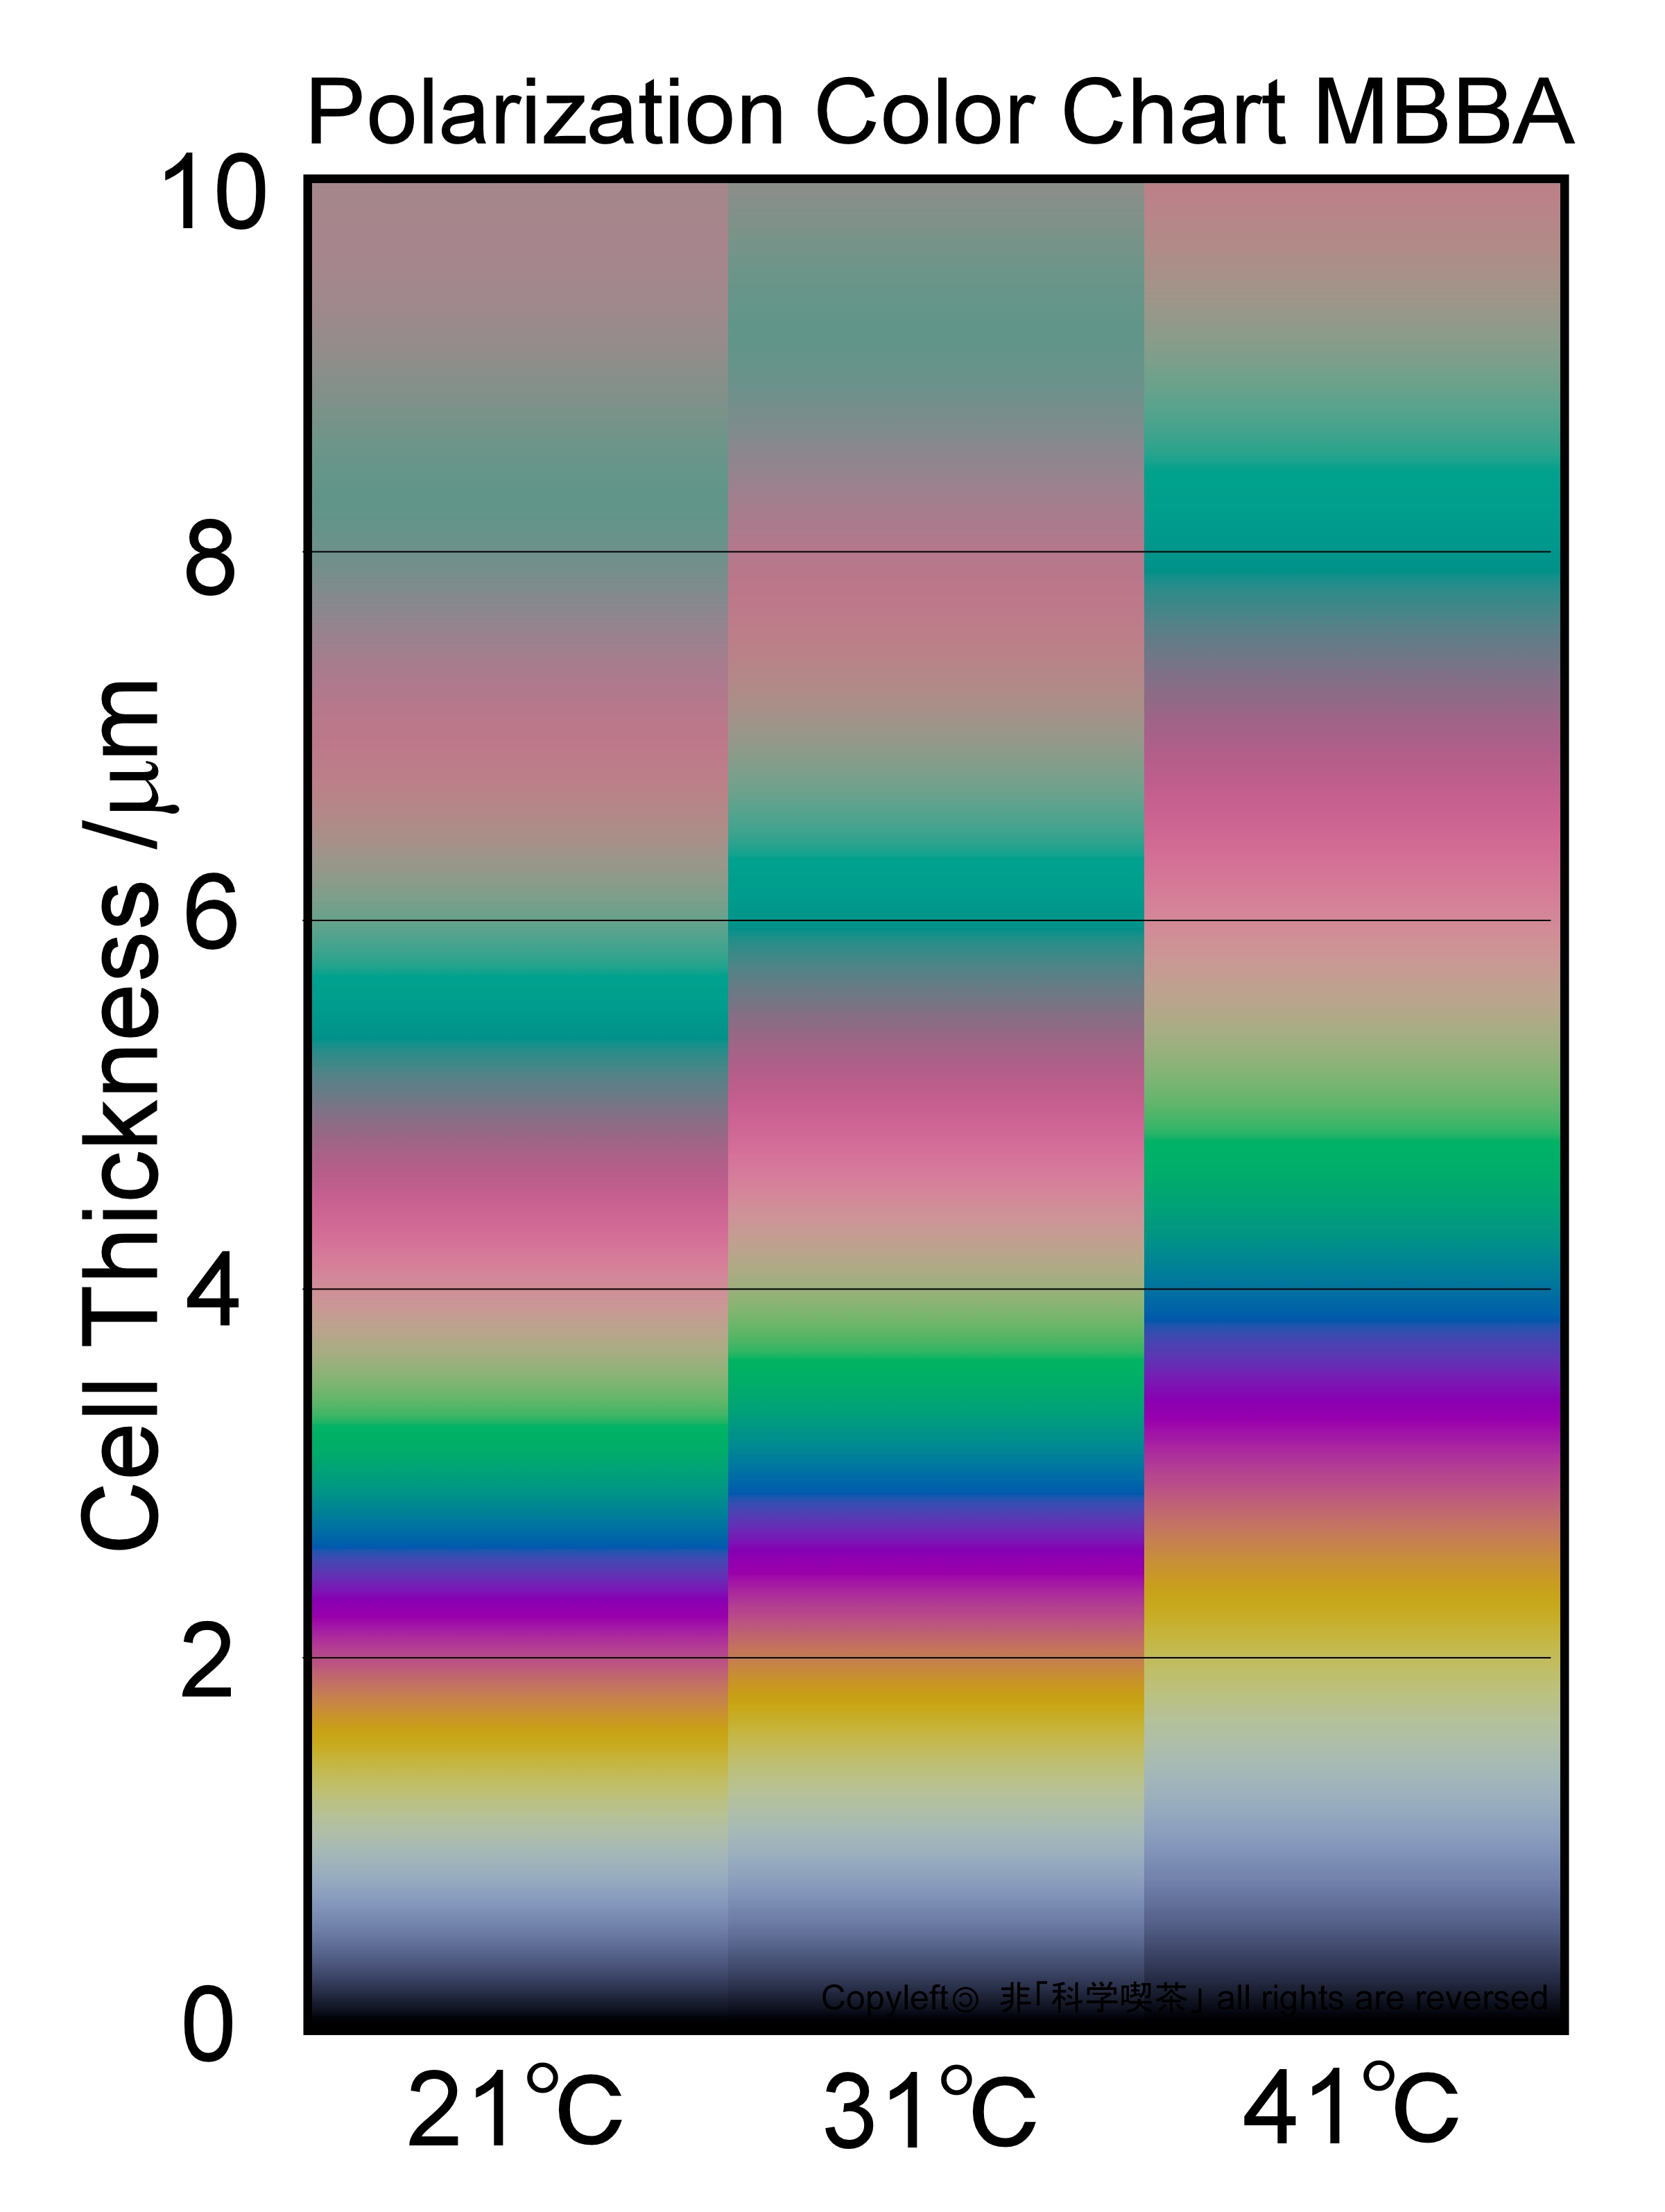
Fig. 5 Polarization Color Chart created using Cauchy’s coefficients of
MBBA
The polarization color of the MBBA chart probably is similar to those of
materials having Schiff base and pale colored liquid crystals. The color
of the 5CB passively is similar to those colorless materials having phenyl
rings in them. In either case, we believe these charts show you more realistic
polarization color than the standard chart for liquid crystal observation.
[1] Dispersion Properties of Refractive Indices of Nematic Liquid Crystals, R. Yamaguchi and S. Sato, The Journal of Institute of Electronics, Information and Communication Engineers C Vol J71-C No.9 PP1241-1247(1988).(Japanese)
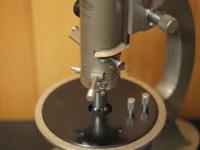
Limitation of Retardation Measurement by Berek Compensator
Berek compensator is a variable phase plate
used with a polarized light microscope to measure the retardation of a sample. It
has a plate of a uniaxial birefringent crystal such as calcite or magnesium fluoride. The optical axis of the crystal is
perpendicular to the surface. By rotating the plate, retardation continuously
increases. The retardation is a function of the rotation angle.
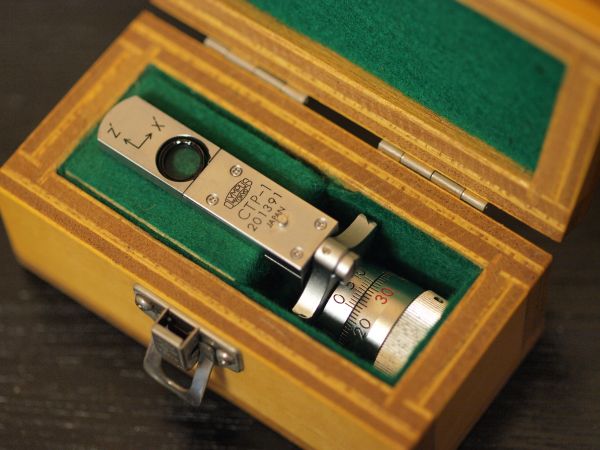
Fig. 1 Berek Compensator
|
Relationship between Retardation and
Rotation Angle
|
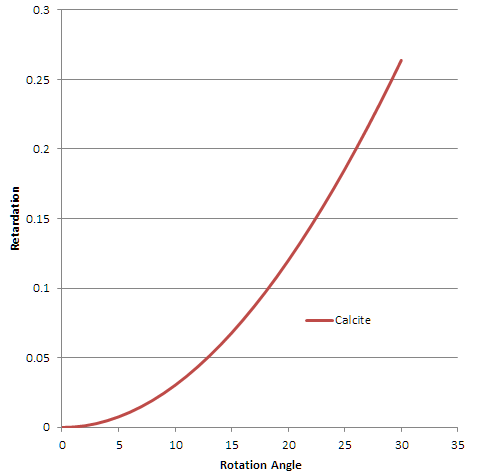
Fig. 2 Relationship between Retardation and Rotation Angle
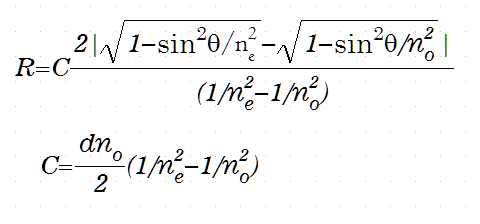
Figure 2 shows the relationship between the angle and the retardation. We have found three equations to express the relationship. One is the equation in the Olympus website.
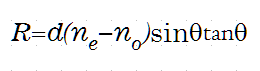
The second one is the approximation formula for tilted uniaxial crystal in the textbook of polarized light microscope written by Tsuboi.
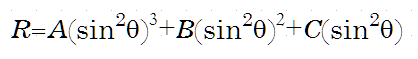
The third one is an empirical formula
obtained by fitting correction table data of a Berek compensator.
These three equations give the same result practically. You can use any of
these equations.
Each compensator has a correction table for
it. Since the thickness of the plate differs
among compensators, the correction table is only valid for the compensator. When you buy a new compensator, you get the table with
it. You should keep the table carefully. It is a good idea to make a
spreadsheet file to calculate retardation from the measured angles. Using the third
formula above, you can easily make such a file. If you do not have a correction
table for your compensator, you can make it by yourself. Prepare phase plates
having known retardation values. Measure the rotation angle of the compensator
for each phase plate. Using the relationship between retardation values and
angles, you can decide the fitting parameters of the third equation.
| Effect of Dispersion on Measurement |
Since refractive indices
have dispersion, birefringence also has dispersion. The dispersions of the
sample and the compensator are different unless they are made of the same
material. The difference makes compensation imperfect. This imperfection does
not cause a serious problem in the measurement when the difference is not
large. Figure 3 shows the simulation results of compensation a quartz plate with
retardation of 2000nm by a compensator made of calcite.
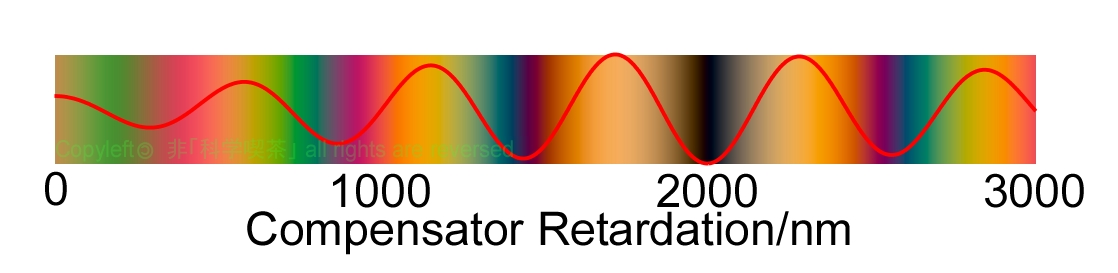
Fig. 3 Compensation Simulation of Quartz plate with retardation of 2000
nm by calcite
As shown in the
figure, polarization color becomes darkest at 2000nm of the compensator. The
brightness also becomes the darkest at this value. For such materials,
birefringence measurement by a Berek compensator gives good results.
In contrast, measurements
give false values when the birefringence dispersion is large so as to show anomalous
polarization color. Figure 4 shows the compensation
simulation of 5CB by a calcite compensator. The reference wavelength of the retardation
is 593 nm, the sodium D-line. When the retardation is 250 nm, the darkest
position is the same as the retardation of the sample. The retardation of the sample
increases, not only the same value but also one order higher value becomes
dark. By plotting Y value of XYZ chromaticity diagram, the darkest value can be
evaluated numerically. The darkest value is the same as the sample till the
retardation value of 750 nm. The one order higher value becomes darkest for
retardation from 1000 nm and higher.
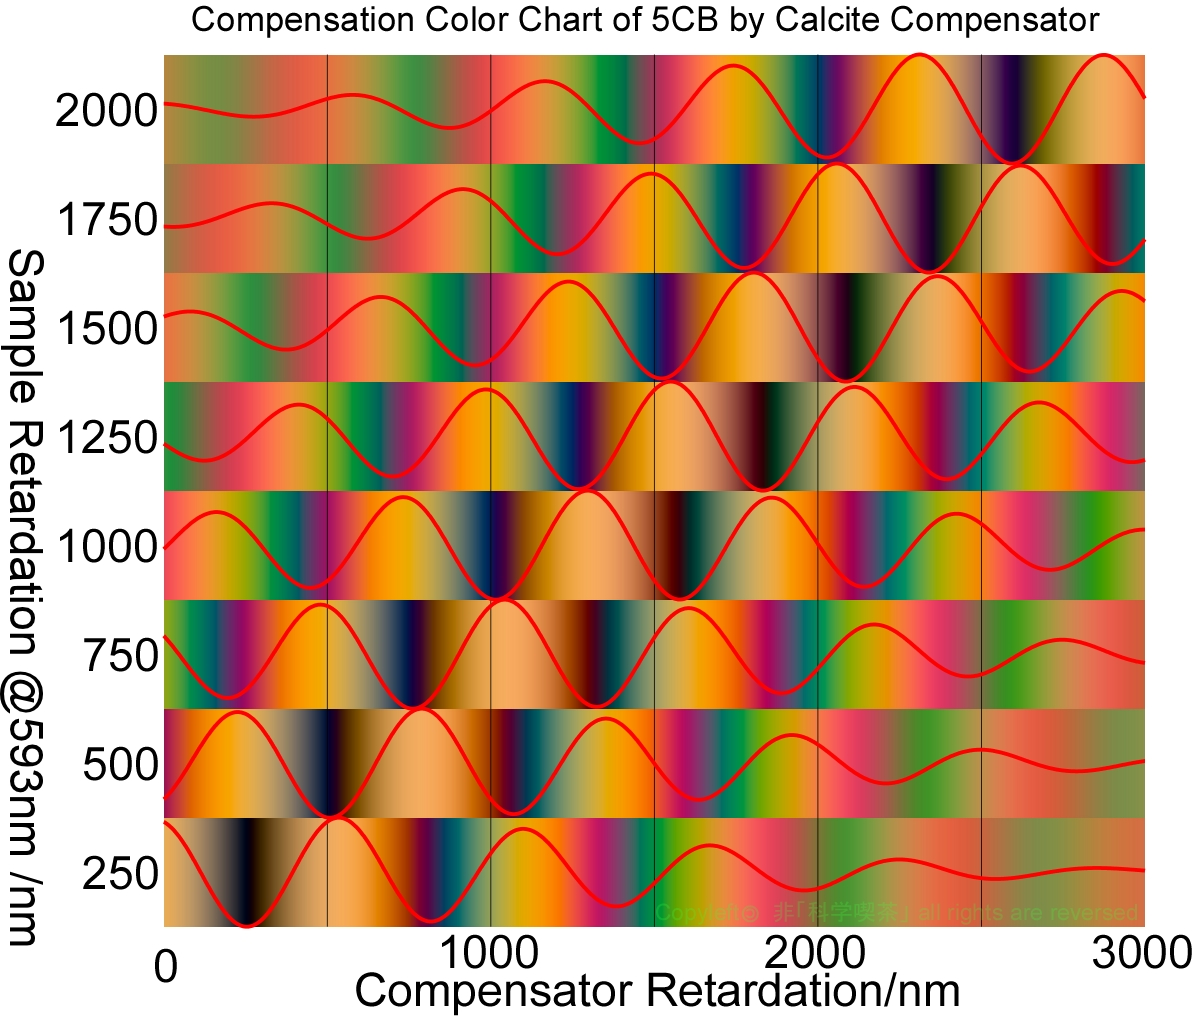
Fig. 4 Compensation of 5CB by Calcite
Sometimes a
monochromatic filter is used with the compensator to make an estimation of the
dark position easier. Fig. 5 is the simulation of compensation with the Nikon
GF green filter. Though the wavelength range is smaller than without the
filter, the brightness of the false value becomes the darkest in higher sample
retardation values. Usage of a bandpass filter doesn't help the decision of the
true compensation value.
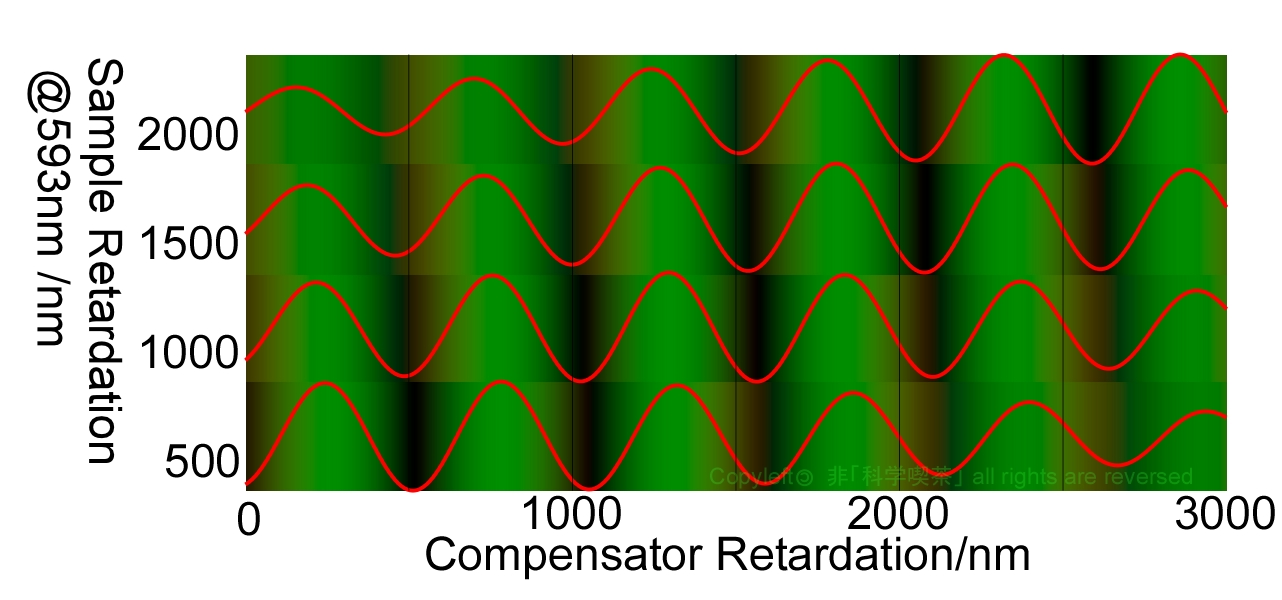
Fig. 5 Compensation of 5CB with green filter
Figure 6 shows the compensation simulation of MBBA by the compensator. Birefringence dispersion of MBBA is bigger than that of 5CB. Therefore, the darkest value changes to the first higher minimum values at 750 nm. And the second higher minimum becomes darkest at the sample retardation of 3000 nm.
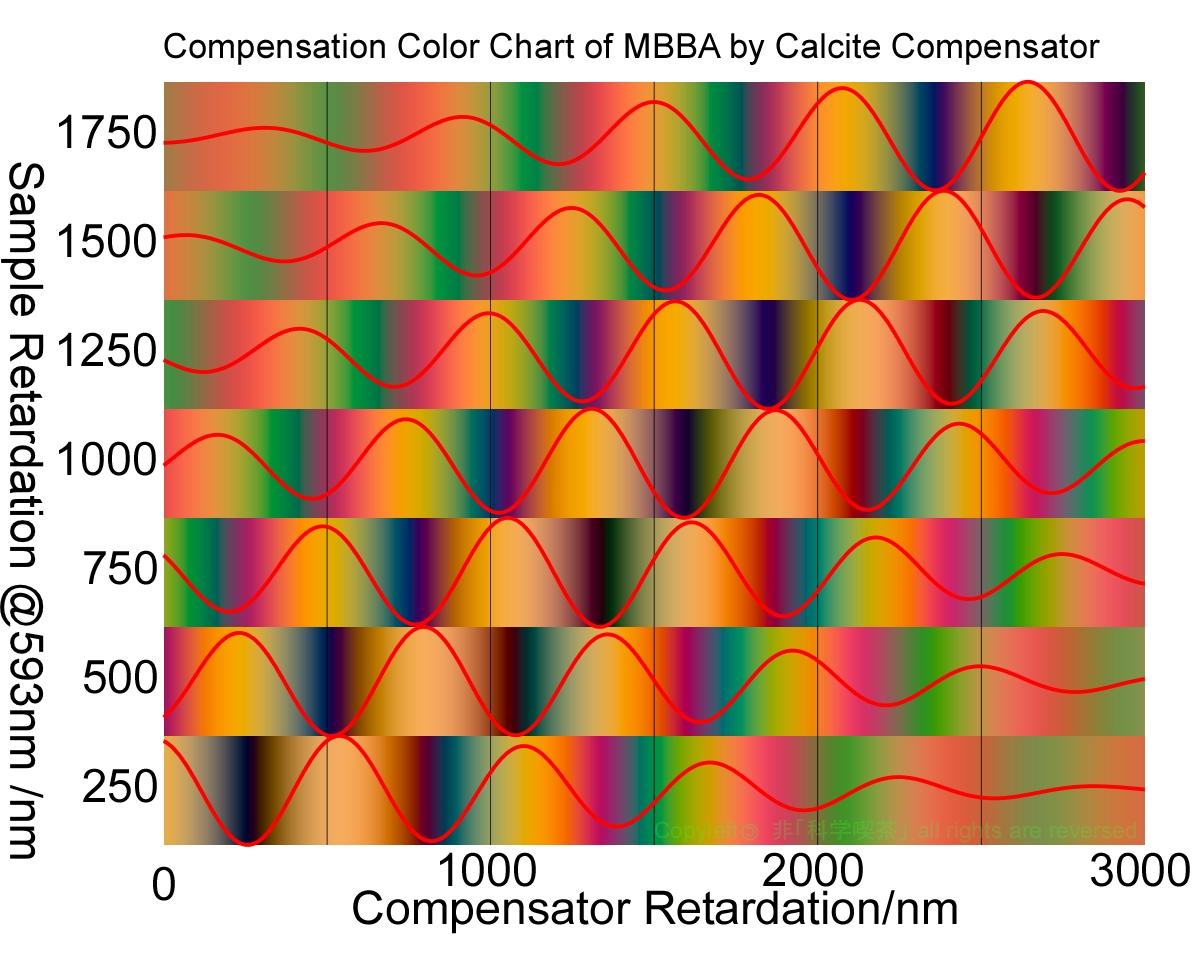
Fig 6. Compensation of MBBA by Calcite
|